What To Make of the New Google Webmaster Tools Site Crawl Data
[dropcap color=”black”]G[/dropcap]oogle recently gave webmasters a nifty little feature inside of GWT that allows you to view your Site Crawl health. Its a helpful little feature for any SEO practitioner to at least take a look at. In the past one could associate this data with a proprietary tool or via manual data collections and trending over time, however, the site: operator at Google is anything but reliable so this can be handy.
I decided to open up a few of the websites I have allowed access into GWT to take a look at them and noted a few things that I thought I would share:
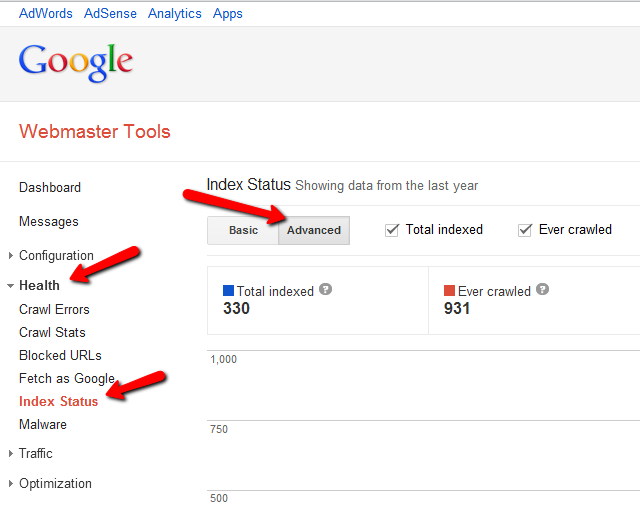
Now if you are not sure how to find this data, here is a quick screencapture on how to navigate to it.
How To Find Google Webmaster Tools Site Crawl Data
Legend (via Google)
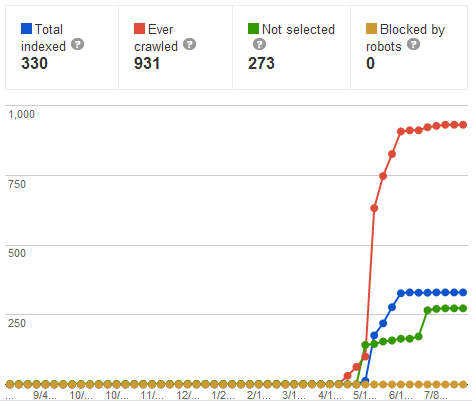
Total Index: The total number of URLs from your site that have been added to Google’s index.
Ever Crawled: The cumulative total of URLs from your site that Google has ever accessed.
Not Selected: URLs from your site that redirect to other pages or URLs whose contents are substantially similar to other pages.
Blocked By Robots: URLs Google could not access because they are blocked in your robots.txt file.
Graph #1
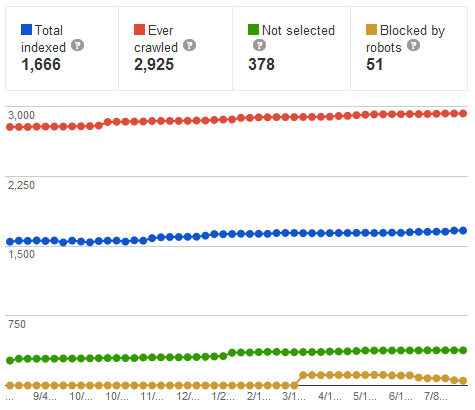
Graph #2
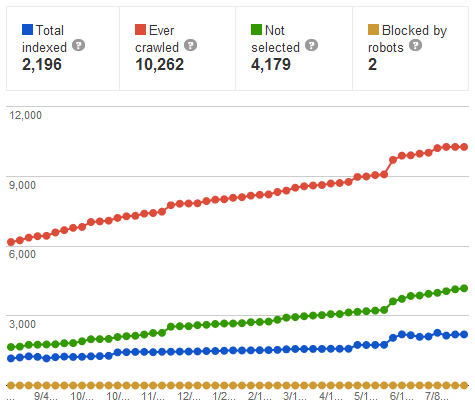
Graph #3
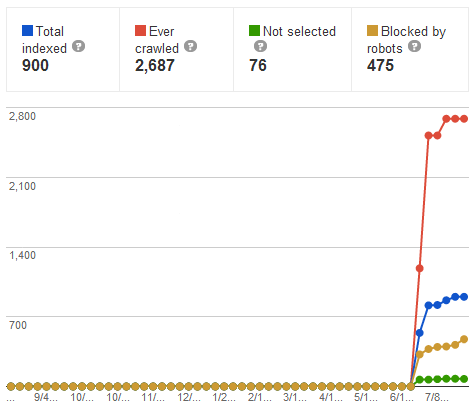
Graph #4
Google Webmaster Tools Site Crawl Takeaways
- ‘Total indexed’ – is what you want to focus on overtime if your site is in content creation mode. Ideally this line should trend up. Keep a close eye on its association with ‘not selected’
- ‘Ever crawled’ – is somewhat interesting when you take into context with total indexed and not selected. Ideally your ever crawled should be near your total indexed in the most efficient scenario. The thinking here would be you give Google BOT exactly what it needs and nothing more to save it time and resources. As you can see above, however, the sites I picked never really had ‘ever crawled’ near ‘total indexed’ since it is in fact a cumulative trend line. The others are not.
- ‘Not selected’ – if this line segment wasn’t in this tool then I probably wouldnt even be writing this post. This is the closest glimpse at Google giving you an indication via THEIR data as to how your site is viewed in terms of indexable content.What might be seen as indexable content, you might ask? Obviously the more unique it is the better, but even rehashed content could be seen as fit and not get grouped into this category.
- If your ‘not selected’ line is above your ‘total indexed’ then you know you have an issue at hand that deserves looking into. Many CMS’s out of the box could create this issue. You can see this is the case in Graph 2 above.
- Overall I would want this segment of the chart to be as near the bottom as possible. Graph #3 above is a good example that I would like to see; a site with a lot of indexed content with very few proportionate pages ‘not selected’. This to me indicates a site in good health. You are controlling the robots appropriately and not wasting their time with ‘bad content’.
- It would be interesting to test graphs that are sites seemingly hit by Panda and compare those to sites that have not been hit by Panda. Remember Panda was GOOGs attempt to remove thin content out of its index.
- ‘Blocked By Robots’ – This is an obvious one that can alert practitioners to situations that might be problematic. Didn’t mean to have 500 pages blocked by Robots.txt? This line can help.


